



| Original Research | ||
Natl. J. Physiol. Pharm. Pharmacol. (2026), Vol. 16(1): 8-12 Original Research A comparative study of visual reaction time and auditory reaction time in automobile industry workers and age-matched controlsGunasekaran Suchithra*, Kannan Umamaheswari and Hassan Srinath SnehaDepartment of Physiology, ESIC Medical College & PGIMSR, Rajajinagar, India *Corresponding Author: Gunasekaran Suchithra, Department of Physiology, ESIC Medical College & PGIMSR, Bangalore, India. Email: drsuchithrag [at] gmail.com Submitted: 31/07/2025 Revised: 30/12/2025 Accepted: 19/01/2026 Published: 05/02/2026 © 2025 National Journal of Physiology, Pharmacy and Pharmacology
ABSTRACTBackground: The automobile industry is a complex and dynamic work environment, where workers are exposed to various visual and auditory stimuli that require rapid processing and response. Reaction time, a critical component of sensory-motor function, plays a vital role in ensuring workplace safety and overall efficiency. However, the physical and mental demands of working in the automobile industry may impact the reaction times of workers, potentially increasing the risks of accidents and errors. Despite these facts, research on the visual and auditory reaction times of automobile industry workers is limited. Aim: This study aimed to assess and compare the visual reaction time (VRT) and auditory reaction time (ART) of automobile industry workers with age-matched controls. Methods: The study population included 55 workers in the automobile industry (Group 1) and 55 non-industrial workers (Group 2). The reaction time was assessed using Inquisit 6.0 computer software released by Millisecond Software, Seattle, Washington, in the year 2020. Statistical analysis was performed with an unpaired t-test using SPSS software version-22. Results: The mean and SD of VRT in industrial and non-industrial workers are 246.16 ± 44.8 and 267.51 ± 34.62, respectively. The mean and SD of ART in industrial and non-industrial workers are 280.38 ± 67.08 and 246.98 ± 29.42, respectively. The statistical analysis revealed a significant difference in VRT and ART between 2 groups, with fast ART in non-industrial workers (p < 0.001) and fast VRT in industrial workers (p < 0.006). Conclusion: The quicker VRT of industrial workers probably stems from the demands of their work environment, whereas their slower auditory reaction time might be attributed to prolonged exposure to noise. This recommends tailored training and interventions to address sensory-motor vulnerabilities, ultimately enhancing workplace safety and operational effectiveness. Keywords: Automobile workers, Auditory reaction time, Visual reaction time. IntroductionThe issue of worker safety and preventable worker injuries in the Indian automobile industry’s supply chains is a national issue that draws urgent attention not only because of the devastating economic and psychological impact it has on injured workers and their families but also on the industries’ domestic and global reputation, professionalism, responsible behaviour and labour productivity (Safe in India Foundation, 2023). Thousands of workers in Indian automotive parts factories suffer disabling injuries to their hands every year (Safe in India Foundation, 2023). Reaction time is a critical factor in the automobile industry, where workers must quickly respond to visual and auditory cues to ensure safety and efficiency. Visual reaction time (VRT) and auditory reaction time (ART) provide insights into an individual’s sensory processing and motor association abilities (Sunitha et al., 2018). A notable gap exists in the literature regarding reaction times in automobile industry workers. This research seeks to bridge knowledge gaps on reaction times in automobile workers by promoting safety and performance. Overall, this study aims to assess and compare the VRT and ART of automobile industry workers with age-matched controls. Material and MethodsThe study population includes 55 automobile industry workers (Group 1 consists of assembly line workers) and 55 age-matched controls who are non-industrial workers (Group 2 consists of administrative and office staff). Sample sizeThis study was based on a previous study conducted by Sunitha et al. (2018) entitled “Comparative study of auditory and VRT in bus drivers and age-matched controls,” in which the mean and SD of auditory reaction time were 216.7 and 11.83, respectively. Based on this information, the required sample for the present study at 95% CI and 80% power is 23, using the following formula:
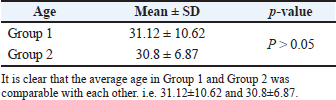
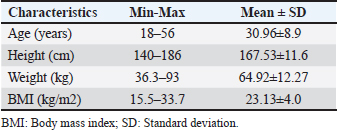
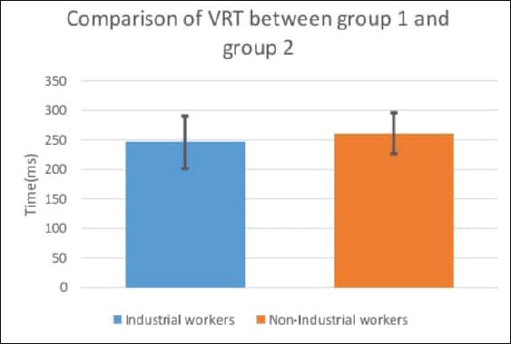
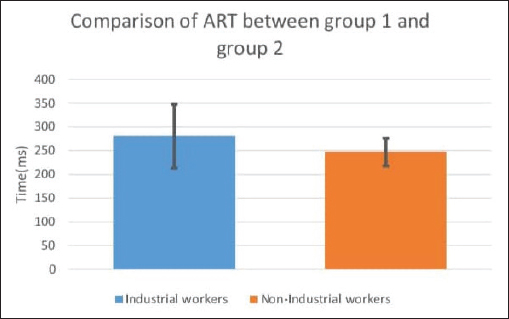
where, n is the sample size, Z is the Z-score corresponding to the desired confidence level (1.96 for a 95% confidence level), σ is the population SD, E is the error margin (acceptable error). Adding 10% to attrition=23 + 2.23=26. Therefore, the sample size is 26. Twenty-six is the minimum sample size required for the study, and a final sample size of 55 in each group was decided to ensure subgroup representation and data quality. Inclusion criteriaAge group: 18-56 years Both genders Subject is willing to provide informed consent. Normal vision and hearing acuity Exclusion criteriaParticipants are not willing to provide informed consent. Auditory and visual impairments Diabetic and hypertensive for >10 years Pathology or injury of the upper limb After the approval and clearance from the institutional ethical committee, 110 subjects who fulfilled the inclusion and exclusion criteria were enrolled in the study after obtaining informed consent. The subjects were clinically examined as per the study protocol. Then, VRT and ART tests were performed using Inquisit 6.0 computer software released in 2020 by Millisecond Software, Seattle, Washington. The study recordings were taken at the start of the work shift. Subjects were made to sit comfortably, and during the VRT task, they were instructed to press the spacebar key on the laptop as a response as soon as the red circle appeared on the screen in the centre of the white background. Similarly, during the ART task, the participants were instructed to press the spacebar key on the laptop as a response as soon as the sound was played for 15–30 seconds at variable time intervals through the headset. A practice trial was also given to every participant before taking the task, and in both tests, all the participants were made to perform the task 10 times, excluding the fastest and slowest values. The lowest value of the middle five was considered. The results are expressed as mean and standard deviation. The results were analyzed using an unpaired t-test with the statistical packages for social sciences (SPSS) software version 22. A p-value <0.05 is considered significant. ResultFrom Table 1, it is clear that the average age in Group 1 and Group 2 was comparable with each other, i.e., 31.12 ± 10.62 and 30.8 ± 6.87 (p > 0.05). The mean age, height, weight, and BMI of all 110 workers are 30.96 ± 8.9, 167.53 ± 11.6, 64.92 ± 12.27, and 23.13 ± 4.0, respectively (Table 2). Table 3 and Figure 1 show that the average VRT in industrial workers (Group 1) was 246.16 and SD=44.8, and in age-matched controls, non-industrial workers (Group 2) were 267.51 and SD=34.62. This difference was statistically significant (p < 0.006, df=102). Table 4 and Figure 2 show that the average ART in industrial workers (Group 1) was 280.38 and SD=67.08, and in age-matched controls, non-industrial workers (Group 2) was 246.98 and SD=29.42. This difference was statistically significant. (p < 0.001, df=74). DiscussionThis study compared the VRT and ART between industrial workers (Group 1) and non-industrial workers (Group 2). The results showed that industrial workers had a mean VRT of 246.16 ms, which was faster than that of non-industrial workers, who had a mean VRT of 267.51 ms. In contrast, industrial workers had a slower mean ART of 280.38 ms than non-industrial workers (246.98 ms). Pain and Hibbs (2007) showed that simple auditory reaction time has the fastest reaction time, which could be less than 100 ms for a given auditory stimulus. Sunitha et al. (2018) explained that ART is usually faster than VRT Jain et al. (2015). Thompson et al. (1992) documented that the mean reaction time to detect visual stimuli is approximately 180–200 ms, whereas for auditory stimuli it is around 140–160 milliseconds. On the other hand, Yagi et al. (1999) showed that the reaction time to visual stimuli is faster than that to auditory stimuli. Table 1. Age wise distribution of the subjects.
Table 2. Descriptive statistics of anthropometric variables of study participants (n=110).
Table 3. Visual reaction time in industrial workers (Group 1) and non-industrial workers (Group 2).
Table 4. Auditory reaction time in industrial workers (Group 1) and non-industrial workers (Group 2).
Figure 1. Comparison of VRT between Industrial workers [Group 1] and Non-Industrial workers [Group 2]. Our findings are consistent with those of Yagi et al. (1999), who showed that industrial workers have a faster visual reaction time. This implies that automobile industry workers in demanding jobs, such as quality control inspection and operating machinery (assembly line workers), may develop faster visual response time as an adaptation to the occupation’s high visual demands, necessitating a quick processing of visual data Kumari et al. (2022). However, the slower ART observed in industrial workers may be due to several factors, such as the following:
On the other hand, the VRT in the automobile industry workers was lower than that in the controls, which might be due to high visual demand, adaptation mechanisms (enhanced visual processing speed, improved attentional focus), neuroplasticity, task relevance, and practice effect.
Figure 2. Comparison of ART between Industrial workers [Group 1] and Non-Industrial workers [Group 2]. This research underscores the importance of routinely assessing the reaction time of workers who face occupational hazards. Early detection of changes in reaction time can help identify workers at risk and prevent accidents. The comparison of VRT and ART sheds light on the varying impacts of workplace hazards on visual and auditory processing. Our findings indicate that workers in the automobile industry are vulnerable to impaired reaction time, emphasizing the need for robust workplace health initiatives. The findings of this study highlight the importance of workplace health and safety measures. Implementing targeted training to improve auditory processing and reduce noise exposure through workplace interventions could help prevent accidents and protect the hearing of industrial workers. Overall, this study contributes to our understanding of the impact of occupational hazards on the reaction time of automobile industry workers. The findings have practical implications for occupational health and safety, highlighting the need for targeted interventions to mitigate the effects of occupational hazards on reaction time. Strength of the study
Limitations
ConclusionThe quicker VRT of industrial workers probably stems from the demands of their work environment, whereas their slower ART might be attributed to prolonged exposure to noise. This recommends tailored training and interventions to address sensory-motor vulnerabilities, ultimately enhancing workplace safety and operational effectiveness. Future scope of study
AcknowledgmentThe authors would like to thank the participants of my study, Department of Physiology and ESIC MC-PGIMSR, Bangalore. FundingSelf-funded. Author contributionAll authors contributed equally in this study. Conflicts of interestThere are no conflicts of interest to declare. Data availabilityAll data were provided in the manuscript. ReferencesJain, A., Bansal, R., Kumar, A. and Singh, K. 2015. A comparative study of visual and auditory reaction times on the basis of gender and physical activity levels of medical first year students. Int. J. Appl. Basic. Med. Res. 5(2), 124–127; doi:10.4103/2229-516X.157168 Kasozi, K.I., Mbiydzneyuy, N.E., Namubiru, S., Safiriyu, A.A., Sulaiman, S.O., Okpanachi, A.O. and Ninsiima, H.I. 2018. A study on visual, audio and tactile reaction time among medical students at Kampala International University in Uganda. Afr. Health. Sci. 18(3), 828–836; doi:10.4314/ahs.v18i3.42 Kumari, S., Bankey, N., Shah, R.K. and Naghate, G.R. 2022. A comparative study of auditory reaction time among blind and blindfolded sighted subjects. Natl. J. Physiol. Pharm. Pharmacol. 12(05), 601–604; doi:10.5455/njppp.2022.12.10381202126102021 M, S., Mankar, K., S, S.Y.B. and Brid, S.V. 2018. Comparative study of auditory and visual reaction time in bus drivers and age matched controls. MedPulse Int. J. Physiol. 6(2), 8–10; doi:10.26611/103621 Pain, M.T. and Hibbs, A. 2007. Sprint starts and the minimum auditory reaction time. J. Sports Sci. 25(1), 79–86; doi:10.1080/02640410600718004 Safe In India Foundation. SafetyNiti 2023: A Safe in India Foundation’s Report [Internet]. Gurgaon: Safe In India Foundation; 2023 [cited 2024 Aug 21]. Available from: https://www.safeinindia.org/_files/ugd/5d022b_abaeb649c412487daa8cdef276ffc94f.pdf Thompson, P.D., Colebatch, J.G., Brown, P., Rothwell, J.C., Day, B.L., Obeso, J.A. and Marsden, C.D. 1992. Voluntary stimulus-sensitive jerks and jumps mimicking myoclonus or pathological startle syndromes. Mov. Disord. 7(3), 257–262; doi:10.1002/mds.870070312 Yagi, Y., Coburn, K.L., Estes, K.M. and Arruda, J.E. 1999. Effects of aerobic exercise and gender on visual and auditory P300, reaction time, and accuracy. Eur. J. Appl. Physiol. Occup. Physiol. 80(5), 402–408; doi:10.1007/s004210050611 | ||



| How to Cite this Article |
| Pubmed Style Suchithra G, Umamaheswari K, Sneha HS. A comparative study of visual reaction time and auditory reaction time in automobile industry workers and age-matched controls. Natl J Physiol Pharm Pharmacol. 2026; 16(1): 8-12. doi:10.5455/NJPPP.2026.v16.i1.2 Web Style Suchithra G, Umamaheswari K, Sneha HS. A comparative study of visual reaction time and auditory reaction time in automobile industry workers and age-matched controls. https://www.njppp.com/?mno=274525 [Access: June 26, 2026]. doi:10.5455/NJPPP.2026.v16.i1.2 AMA (American Medical Association) Style Suchithra G, Umamaheswari K, Sneha HS. A comparative study of visual reaction time and auditory reaction time in automobile industry workers and age-matched controls. Natl J Physiol Pharm Pharmacol. 2026; 16(1): 8-12. doi:10.5455/NJPPP.2026.v16.i1.2 Vancouver/ICMJE Style Suchithra G, Umamaheswari K, Sneha HS. A comparative study of visual reaction time and auditory reaction time in automobile industry workers and age-matched controls. Natl J Physiol Pharm Pharmacol. (2026), [cited June 26, 2026]; 16(1): 8-12. doi:10.5455/NJPPP.2026.v16.i1.2 Harvard Style Suchithra, G., Umamaheswari, . K. & Sneha, . H. S. (2026) A comparative study of visual reaction time and auditory reaction time in automobile industry workers and age-matched controls. Natl J Physiol Pharm Pharmacol, 16 (1), 8-12. doi:10.5455/NJPPP.2026.v16.i1.2 Turabian Style Suchithra, Gunasekaran, Kannan Umamaheswari, and Hassan Srinath Sneha. 2026. A comparative study of visual reaction time and auditory reaction time in automobile industry workers and age-matched controls. National Journal of Physiology, Pharmacy and Pharmacology, 16 (1), 8-12. doi:10.5455/NJPPP.2026.v16.i1.2 Chicago Style Suchithra, Gunasekaran, Kannan Umamaheswari, and Hassan Srinath Sneha. "A comparative study of visual reaction time and auditory reaction time in automobile industry workers and age-matched controls." National Journal of Physiology, Pharmacy and Pharmacology 16 (2026), 8-12. doi:10.5455/NJPPP.2026.v16.i1.2 MLA (The Modern Language Association) Style Suchithra, Gunasekaran, Kannan Umamaheswari, and Hassan Srinath Sneha. "A comparative study of visual reaction time and auditory reaction time in automobile industry workers and age-matched controls." National Journal of Physiology, Pharmacy and Pharmacology 16.1 (2026), 8-12. Print. doi:10.5455/NJPPP.2026.v16.i1.2 APA (American Psychological Association) Style Suchithra, G., Umamaheswari, . K. & Sneha, . H. S. (2026) A comparative study of visual reaction time and auditory reaction time in automobile industry workers and age-matched controls. National Journal of Physiology, Pharmacy and Pharmacology, 16 (1), 8-12. doi:10.5455/NJPPP.2026.v16.i1.2 |